Abstract
The phytochemical composition and in vitro anti-inflammatory potential of moringa products - a standardized flavonoid-rich leaf extract obtained by optimized process (cultivation, harvest, and extraction) and six commercial samples of dried moringa leaf extract or powder - were evaluated. Samples had their total phenolic content, chemical profile (by TLC and HPLC), vitexin content and in vitro anti-inflammatory activity determined and compared. The standardized leaf extract showed the highest phenolic content and a more complex chromatographic fingerprint than commercial samples, as well as the most potent anti-inflammatory activity, suppression of nitric oxide production, down-regulation of the expression of pro-inflammatory genes iNOS and TNF-α, and upregulation of anti-inflammatory gene IL-10 at 50 μg/mL. Overall, the commercial dried moringa leaf extracts showed better results than leaf powder samples. Our findings support the importance of manufacturing standardization to produce reliable moringa products for pharmaceuticals, cosmetics, or supplements.
Supply chain; Quality control; Phenolics; Standardization; Natural products
Introduction
Moringa oleifera (Moringaceae family) is a deciduous tree originating from southeastern Asia but naturalized worldwide[1,2]. Several common names are associated with this plant, including "moringa", "drumstick tree", "horseradish tree", or "miracle tree"[3]. Various parts of this multipurpose plant can be utilized for human and animal nutrition. In addition, it has traditionally been used for medicinal and health-related applications, being considered a nutraceutical plant4,5].
The supply chain of herbal and medicinal products is commonly a collection of multinational suppliers, factories and distributors[6]. For instance, one country may supply the raw materials that are shipped to a second location where products are manufactured, and the sales or consumption of the final product usually might occur in a third country. During this intricate supply chain, essential information regarding the correct identification of plant species, cultivation methods, type of extraction, compound content, and production protocols is frequently lost. Moreover, there is no unified legislation across countries7, and adulteration of plant species, presence of unaccounted plant parts (i.e., roots), contamination (i.e., insects, sand), or extraneous isolated compounds have been reported[8]. Therefore, quality control is essential to avoid low-quality products and potentially harmful side effects. As a result, it is critical and urgent to strengthen the development of a standardized supply chain to ensure the quality control of medicinal plant-based products[9].
Despite this, in the last few years, many moringa products with disputable quality levels obtained by poorly controlled and non-standardized process have flooded the markets worldwide[10]. Commercial M. oleifera products are now available in India, Africa, China, South, North and Central America, including Brazil, EUA, Mexico, and Hawaii,,, and throughout Asia (Caribbean Islands) and Southeast Asia (Cambodia)[10,11]. It is known, for example, that a common traditional preparation protocol for green leafy herbal medicines consists of simply drying and pulverizing the leaves, with no further refining steps or quality control12,13]. There is no information in the worldwide moringa official monographs about efficacy, safety, or quality control data for this plant species. Standardization protocols and regulations are crucial for farmers, the medicinal plant industry, and policy makers to establish Good Agricultural Practices (GAP) and produce high-quality herbs[4]. Given this, research groups should concentrate efforts on defining and establishing standardization protocols, phytochemical profiles, and analytical method development to warrant the expected therapeutic effects attributed to moringa.
Therefore, the aim of this study was to compare the phytochemical profiles and in vitro anti-inflammatory activity of two types of moringa leaf products: developed moringa extract produced under standardized and controlled conditions as shown in our previous research project14 and commercial moringa products consisting of dried leaf extract and powder from Brazil, China, India, and the USA. Our hypothesis is that moringa samples produced under controlled production protocols would have higher bioactive content and improved anti-inflammatory potential than non-standardized moringa samples. To answer our research question, we evaluated the total phenolic content (TPC), phytochemical fingerprint, and vitexin concentration of moringa leaf products. Furthermore, the in vitro anti-inflammatory activity of moringa-derived products was assessed, as well as the pro-inflammatory gene expression in macrophage cells. To the best of our knowledge, this is the first study comparing the phytochemical composition and anti-inflammatory activity of moringa leaf products developed under standardized conditions versus commercial samples obtained from different countries. The results of this study will help build a scientific platform that benefits the entire supply chain of moringa products and can be used as a working template for other medicinal plants.
Materials and Methods
Plant material
Moringa oleifera leaf derived products investigated in this study are described in TABLE 1. The developed moringa extract was obtained through standardized conditions from cultivation until the final dry leaf extract (cultivation, harvest, and extraction) as described in our previous study[14]. Briefly, Moringa plants were cultivated in an open field at the Federal University of Rio Grande do Norte facilities (GPS coordinates: latitude: -5.900133 and longitude: -35.357028) in mineral soil (100% mineral soil fertilizer, 131 kg/ha of ammonium sulfate, triple superphosphate, and potassium chloride) and harvested during the drought season in August 2018 (average rainfall of 6.1 mm/month). Liquid nitrogen was used to conserve the phytochemical metabolism of the samples after harvest and during processing[14]. The identification of the plant species was conducted by depositing a voucher at the Herbarium of the Center of Biosciences of the Federal University of Rio Grande do Norte, Brazil (UFRN 25423). This research was authorized by the National System for the Management of Genetic Heritage and Associated Traditional Knowledge (SISGEN process n. A5DB251). Additionally, six commercial products were purchased as M. oleifera dried leaf extract or as leaf powder from different companies and countries: China (purchased in a Brazilian compounding pharmacy, sample 2), Brazil (purchased in Brazilian supermarkets, samples 3 and 4), India (purchased online in the USA, sample 6) and USA (purchased online, samples 5 and 7), as described in TABLE 1.
Extraction of moringa samples
For the developed moringa extract (sample 1) consisting of M. oleifera leaf powder, samples were extracted using one previously optimized flavonoid extraction method[14]. Briefly, the extraction was carried out by vortexing the plant material with 80% aqueous ethanol (1:10 extraction ratio w/v) followed by solid-liquid extraction using an ultrasound bath (ultrasonic bath, Kondortech, CD-4860, power 310 W, frequency 50 kHz) for 13.5 min. Samples 2 and 5 consisted of dried moringa leaf extract and were solubilized in 80% aqueous ethanol before analysis. Samples 3, 4, 6, and 7 consisted of commercial moringa products (dried leaf powders) and were extracted using the methodology previously described for the developed sample[14]. All samples were stored at −20°C until use.
Water activity, moisture, and color of moringa samples
The water activity (Aw) of dried plant material was determined (Aqualab equipment, model 3TE, Decagon Devices, Pullman, WA, USA) at room temperature (25°C) in triplicate. Moisture was determined using a moisture analyzer (HE53, Metter Toledo,Columbus, OH, USA) using 500 mg of samples. Instrumental color by CIELAB parameters (L*, a*, and b*) was evaluated using a colorimeter (CR-400, Konica Minolta, Japan) where L* indicates brightness/darkness (0: black and 100: white), a* relates to green (−a*)/red (+a*) coordinates and b* relates to blue (−b*)/yellow (+b*) coordinates.
Total phenolic content (TPC) by Folin–Ciocalteau assay
Moringa leaf product samples (20 mg) were eluted twice with 1 mL of 80% methanol in water with 2% acetic acid, sonicated for 5 min at 50 °C and centrifuged for 10 min at 12,000 x g. The supernatants were pooled together and submitted to TPC quantification using a microplate-adapted Folin-Ciocalteu method[15]. Absorbance was read at 765 nm using a UV-Vis microplate reader (BioTek Epoch 2, Agilent, Santa Clara, CA, USA) and results were expressed as milligrams of gallic acid equivalent (GAE) per gram of sample (mg GAE/g sample) according to an external gallic acid calibration curve.
Thin layer chromatography (TLC) analysis: fingerprint and qualitative evaluations
Initially, hydroethanolic sample extracts were prepared at 20 mg/mL concentration using 100% methanol as solvent and applied with glass capillaries. Thin layer chromatography (TLC) was performed on aluminum foil plates measuring 4.5 cm x 6.0 cm covered with silica gel 60 F254 (Macherey-Nagel, Düren, Germany). After application, the plate was added to a glass chamber (6 cm x 10 cm) previously saturated with the mobile phase (ethyl acetate: acetone: acetic acid: water, in the proportion of 60:20:15:10 v/v/v/v) for 10 min. Once the elution was complete, the revealing solution Natural Reagent A 0.5% (0.5% 2-Aminoethyl diphenylborinate in 100 mL of methanol) was sprayed to show the presence of the compounds of interest. The observation was made in a darkroom with ultraviolet light at a wavelength of 365 nm.
HPLC-DAD analysis: fingerprint, qualitative and quantitative evaluations
It was conducted using a high-performance liquid chromatography system (Shimadzu Prominence LC-2030, Columbia, MD, USA) equipped with a degasser (DGU-20A 5R), Pump (LC 20 AR), autosampler (SIL-20A HT), column oven (CTO-20A), and diode array detector (DAD, SPD-M20A). Samples (20 μL, 10 mg/mL) were separated at 30°C on a Restek Ultra C18 column (250 mm × 4.6 mm × 5 μm; Bellefonte, PA 16283) and a Restek Ultra C18 guard column (10 mm × 2.1 mm, 5μm) at a solvent flow rate of 1 mL/min. The mobile phase consisted of A (0.1% formic acid in water) and B (acetonitrile). The elution started at 10% of B for 5 min, and the gradient increased linearly from 10% to 55% B (v/v) at 35 min, to 95% B at 37 min, maintained for 2 min at 95%, and subsequent re-equilibration period of 6 min (10% B). The DAD was set at 261, 274, 310, and 324 nm to record peak intensities. The chromatographic evaluation was undertaken using Shimadzu LabSolutions software. The reference standard used was the flavonoid C-glycoside vitexin (≥ 95.0%, HPLC- Sigma®). The presence of vitexin was confirmed through a comparison of its retention time, UV spectra, and increase in the peak area of vitexin in an extract with a solution of a developed moringa extract (sample 1) + vitexin (1:1, v/v). A calibration curve was realized with six level points (0; 5; 1; 5; 10; 50; and 100 mg/mL) to quantify vitexin at 324 nm.
Macrophage cell cultures
Murine macrophage cell line RAW 264.7 (ATCC® American Type Culture Collection, Rockville, MD, WI, USA) was maintained in Dulbecco's modified Eagle's medium (DMEM, Life Technologies, New York, NY, USA) supplemented with 100 IU mL1 penicillin, 100 μg mL1 streptomycin (Thermo Fisher Scientific, Waltham, MA), and 10% fetal bovine serum (FBS, Life Technologies, Long Island, NY), according to our previously reported protocol15. A minimum density of 5×10⁵cells/mL was maintained at 37°C in a humidified incubator with 5% carbon dioxide before the analysis. RAW 264.7 cells were used for cell viability (MTT), reactive oxygen species (ROS), nitric oxide radical inhibition (NO), anti-inflammatory, and antioxidant in vitro assays.
Cell viability assay
Viability tests were determined using the 3-(4,5-dimethylthiazol-2-yl)-2,5-diphenyl-tetrazolium bromide (MTT) assay (Sigma-Aldrich Inc., St. Louis, MO) with RAW 264.7 1.2 × 10⁶ cells/well seeded in sterile 96-well microplates (NunclonTMDelta Surface, Thermo Scientific, San Jose, CA, USA) in triplicate with Eagle's minimal essential medium (DMEM). After adhesion and confluence over 24 h of exposure, cells were treated with moringa samples (TABLE 1). Moringa extracts at 50 µg/mL (defined according to previous results by Silva et al.[14]) were analyzed. Negative (80% ethanol) and positive controls (1% dimethyl sulfoxide, DMSO, Sigma-Aldrich, St. Louis, MO, USA) were used. Samples were incubated at 37°C in a 5% CO2 incubator for 4 h. After that, the media was discarded, 100 µL of DMSO was added, and results were determined spectrophotometrically using a microplate reader (Synergy H1, Biotek, Winooski, VT, USA) at 570 nm according to previously reported protocol16.
Reactive oxygen species (ROS) assay
RAW 264.7 macrophage cells were seeded at approximately 9.4×10⁵ cells/well into sterile 24-well plates (NunclonTM Delta Surface, Thermo Scientific, San Jose, CA, USA) and kept overnight at 37°C in a 5% CO2 incubator. After adhesion and confluence over 24 h, cells were exposed to a fresh fluorescent medium consisting of 50 μM solution of dichlorodihydrofluorescein diacetate acetyl ester (H2DCFDA) (Sigma-Aldrich, St Louis, MO, USA) in 95% ethanol for 30 min. After aspiration of the medium, cells received 1 μL of the sample (50 μg/mL final concentration), 10 μL of LPS 100 µg/mL (Escherichia coli 127: B8, 1 μg/mL), and incubated for 18 h. The fluorescence of 2′,7′-dichlorofluorescein (DCF) was measured at 485 nm (excitation) and 515 nm (emission) using a microplate reader (Synergy H1, Biotech, Winooski, VT). The positive control consisted of 10 μM of pyrrolidinedithiocarbamate ammonium (PDTC) (Sigma-Aldrich Inc., St. Louis, MO, USA), which is a potent inhibitor of the nuclear factor-κB (NF-κB) signaling pathway[17]. Results were expressed as ROS production (%) relative to LPS induction. This protocol was adapted from[18].
Nitric oxide (NO) radical inhibition assay
It was determined by a colorimetric assay using the Griess reagent system (Promega Corporation, ref. G2930, Madison, WI, USA). RAW 264.7 were seeded in sterile 24-well plates (NunclonTM Delta Surface, Thermo Scientific, San Jose, CA, USA) with DMEM. After adhesion and confluence over 24 h, cells were treated with moringa samples along with negative (80% ethanol) and positive controls (10 μM dexamethasone, DEX 2 μL, for RAW 264.7). Next, the inflammatory and oxidative stress responses were induced by 10 ng/mL of LPS (Escherichia coli 127: B8, 1 μg/mL). After incubation at 37 °C and 5% CO2 (RAW 264.7: 18 h), 50 μL of each cell-free supernatant was transferred to a 96-well microplate, and 50 μL of Griess reagent 1 (1% sulfanilamide) was added to each well and incubated at room temperature for 10 minutes. Then, the plate was mixed for 1 min and centrifuged for 1 min. In sequence, 50 μL of Griess reagent 2 (0.1% N-(1-naphthyl) ethylenediamine dihydrochloride) was mixed for 1 min and centrifuged for 1 min. The absorbance was read at 520 nm on a microplate reader (Synergy H1, Biotek, Winooski, VT, USA). A calibration curve built with serial dilutions of sodium nitrite (1.56–100 µM, R2 = 0.990) was used to calculate NO concentration. The results were expressed as NO production (%) relative to LPS induction.
In vitro anti-inflammatory and antioxidant assays
RAW 264.7 cells were seeded in 24-well plates and treated with 50 μg/mL (final concentration) of moringa samples to evaluate their anti-inflammatory activity. Cells were stimulated by LPS (from Escherichia coli O127: B8), then incubated (RAW 264.7: 18 h) at previously listed conditions in item 2.8. Positive control dexamethasone (DEX, 10 μM) was used at 1 μL (RAW 264.7) as a positive control. Cells were treated for 1 h before elicitation with 1 μg/mL of LPS for an additional 4 h.
Total RNA extraction, purification, and cDNA synthesis
The mRNA was extracted and isolated from each cell type using TRIzol reagent (Life Technologies, Grand Island, NY, USA) following the manufacturer's instructions. The mRNA was quantified spectrophotometrically using a Synergy H1/Take 3 microplate reader (BioTek, Winooski, VT, USA). Next, 2 µg of mRNA for each sample was used to synthesize the cDNAs, and a commercially available high-capacity cDNA Reverse Transcription kit (Thermo Fisher Scientific Baltics, Vilnius, Lithuania) was utilized according to the manufacturer's protocol on a thermal cycler ABI GeneAmp 9700 (Life Technologies, Grand Island, NY, USA).
Quantitative PCR analysis
Real-time quantitative polymerase chain reaction (qPCR) was used to amplify the resulting cDNA using SYBR Green PCR Master Mix (Life Technologies, Grand Island, NY, USA). Only intron-overlapping primers were selected to avoid interference due to genomic DNA contamination. The primers used for RAW 264.7 cells are described in TABLE 2.
The qPCR amplification was performed in an ABI 7500 Fast real-time PCR (Life Technologies, Grand Island, NY, USA) using 1 cycle at 50°C for 2 min and 1 cycle of 95°C for 10 min, followed by 40 cycles of 15 s at 95°C and 1 min at 60°C. The dissociation curve was completed with 1 cycle of 1 min at 95°C, 30 s at 55°C, and 30 s at 95°C. The mRNA expression was analyzed using the 2-CT method and normalized concerning the expression of the β-actin housekeeping genes using 7500 Fast System SDS Software v1.3.0 (Life Technologies, Long Island, NY, USA). Results were expressed with the LPS set as the maximum genetic induction (1.0). Values < 1.0 indicate transcriptional down-regulation (gene expression inhibition) while values > 1 imply overexpression of a particular gene compared with LPS. The amplification of specific transcripts was further confirmed by melting curve profiles.
Statistical analysis
Results were expressed as the mean ± standard deviation (SD). TPC, NO, and ROS were analyzed by one-way ANOVA followed by Dunnett's post hoc multiple comparison tests using significant difference of p < 0.05, unless noted. All statistical analyses were performed using GraphPad Prism version 6.0 (GraphPad Software, San Diego, CA, USA). All samples were analyzed at least in duplicate, unless noted..
Results and Discussion
Water activity, and color of moringa leaf products
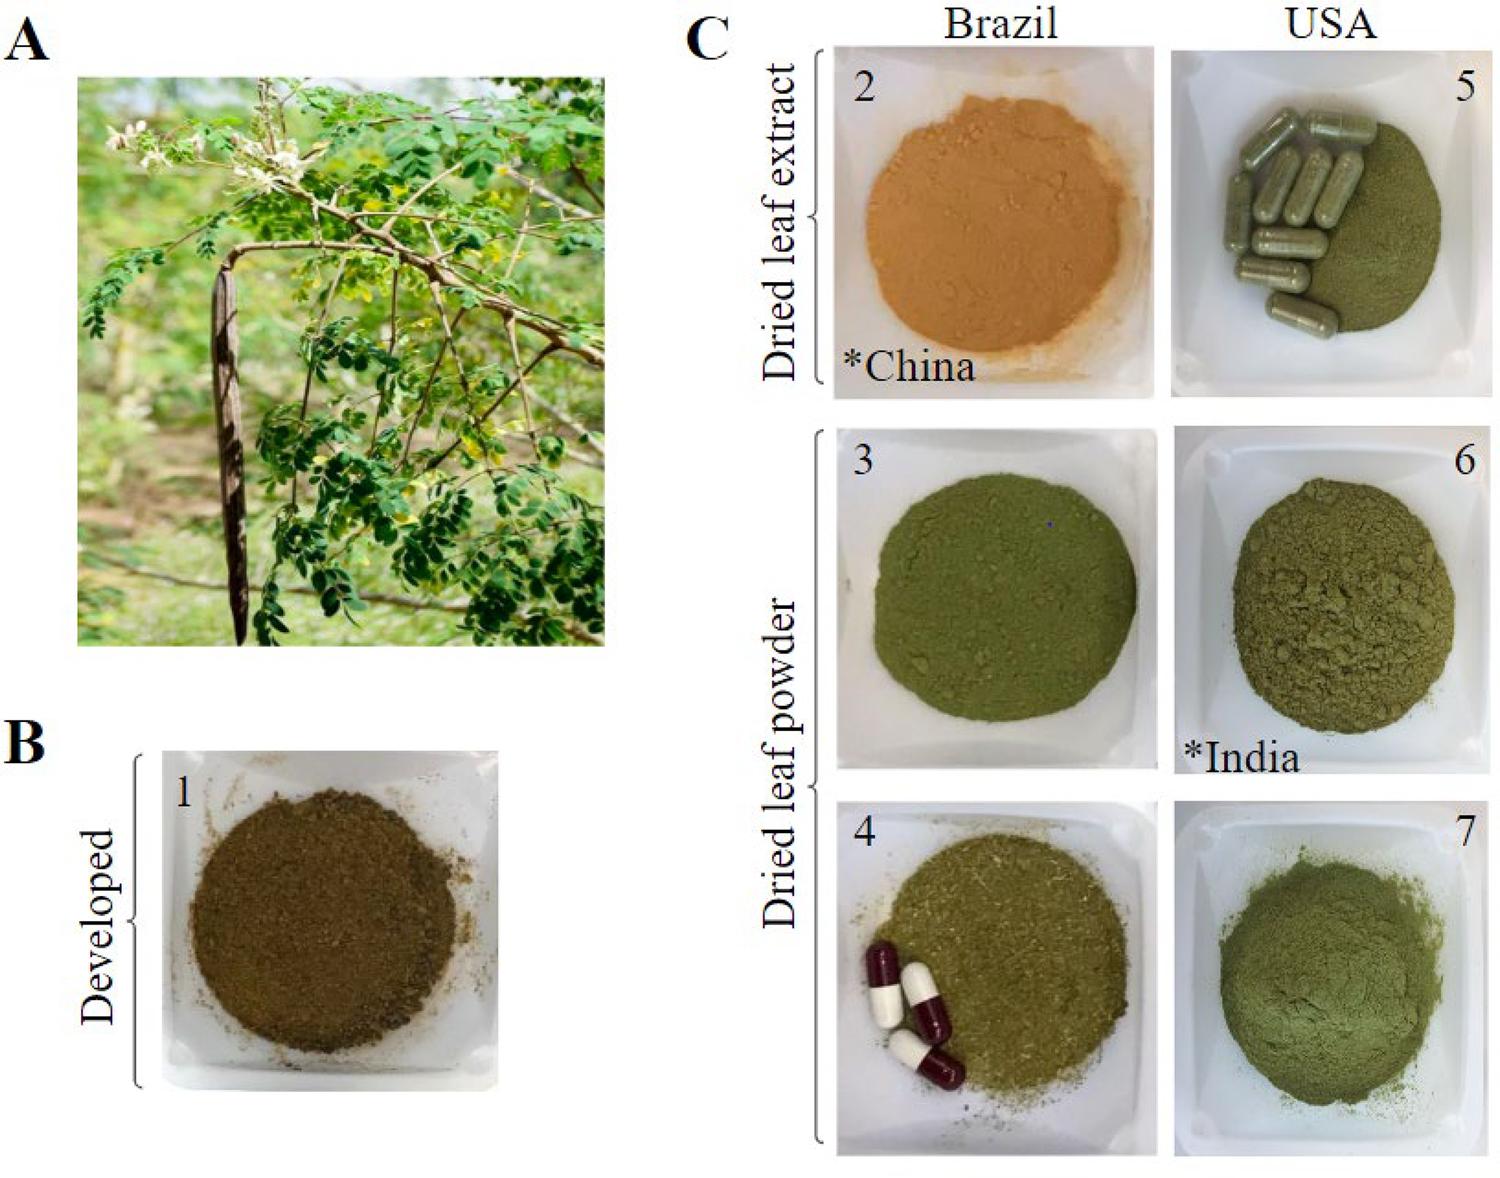
Water activity (Aw) is a key physicochemical parameter that influences powder stability and storage, while color parameters influence consumer acceptance and visual quality control. Moringa leaves (FIGURE 1A) are characterized by intense green color due to their high content of chlorophyll pigments[19]. The Aw of the samples ranged between 0.2670 and 0.4084 (TABLE 3), with sample 1 exhibiting the lowest value (0.2670 ± 0.0068; p < 0.05). It is noteworthy that all samples showed Aw levels within the microbiologically safe range, as established by İlhan Dincer & Temiz[20]. Significant color differences were observed among moringa samples. Particularly, sample 1 showed significantly lower L* values (24.47 ± 1.25; p < 0.05), correlating with its visually darker appearance (FIGURE 1B) compared to the commercial samples (samples 2-7). Results of b* values show that all data were in the first quadrant (+b*), indicating a clear tendency to yellowish tones. However, sample 2 showed the highest values (33.79 ± 0.59; p < 0.05) which correlates with the distinctive yellow color observed for this sample (FIGURE 1C). Samples 3, 5, 6 and 7 showed negative a* values as an index of their vibrant green color, while sample 2 showed opposite high a* values, typical of more reddish colors. This finding agrees to its visual aspect trending to lightly browned/orange color instead of shades of green found for all other samples (FIGURE 1C). Indeed, sample 2 does not match the anticipated attributes for a hydroethanolic leaf extract (expected to be green[19]), and we hypothesize that it was obtained with water as the extraction solvent. These results demonstrated that color could be used as an additional factor for the quality of control of these samples.
Total phenolic content (TPC)
Moringa leaves are reported to have substantial phenolic content, especially flavonoid metabolites[21]. The developed moringa extract (sample 1) had the highest phenolic content (58.4 ± 1.7 mg GAE/g). Like the developed moringa extract (sample 1), samples 2 and 5 were obtained from dried moringa leaf extracts. However, both samples had significantly lower TPC (sample 2: 7.2 ± 0.3 mg GAE/g and sample 5: 17.3 ± 0.5 mg GAE/g), when compared to sample 1 (p < 0.05). This demonstrates the higher quality of plant products cultivated under well-stablished conditions and extracted through an optimized process that allows for the maximum exploitation of the plant potential[14]. The TPC of moringa products obtained from dried leaves (samples 3, 4, 6 and 7) were significantly different (p < 0.05) and ranged from 22.6 ± 0.8 mg GAE/g (sample 7) to 32.9 ± 1.7 mg GAE/g (sample 4), which reflects the lack of production standardization of commercially available moringa products (FIGURE 2A).
The concentration and profile of phytochemicals as well as their pharmacological characteristics may vary based on the environmental conditions, seeds, cultivation, maturity of the plant, extraction process, harvest and post-harvest processing, and storage conditions4,22]. Due to the low traceability and lack of information on commercial product labels, we did not have access to details regarding the preparation and extraction of commercial moringa products. Fejér et al.[10] observed different phenolic content for moringa leaf powders (23.7 ± 1.36 mg GAE/g) and crushed moringa leaves (15.6 ± 1.14 mg GAE/g DM) prepared by different methods. Likewise, it has been demonstrated that the type of drying method dictates the phytoconstituents in the final product, mainly its phenolic content[12].
Qualitative fingerprint by TLC
TLC is a classic technique that has been used to characterize herbal medicine products with an established chemical fingerprint[23]. Even though moringa leaves have been studied worldwide and some main secondary metabolites have been described, a well characterized chemical fingerprint for this species is not available yet.
Significant differences in the samples chemical compositions can be expected considering the distinct visual aspect of moringa products evaluated in this study (FIGURE 1B and 1C). Indeed, the TLC fingerprint of sample 2 (FIGURE 2B) was clearly distinguishable from the other samples, presenting a light blue color and absence of characteristic bands and chlorophyll. The absence of a chlorophyll band agrees with our hypothesis that the different color of sample 2 (light brown, FIGURE 1C) might be a result of a water-based extraction process, rather than an alcoholic extraction. Taking all together, these results suggest that the color of herbal products are related to their chemical composition and could be considered as a valuable indicator of possible quality non-conformance. At the same time, it was possible to identify classes of organic compounds present in the samples based on the color of the observed spots, which in turn resulted from derivatization with Natural Reagent A (2-aminoethyl diphenylborinate). According to the literature, yellow-orange spots were attributed to non-anthocyanin flavonoids, while phenolic acids and anthocyanins could appear as fluorescent blue and purple spot[23], (as observed in FIGURE 2B in the region of bands outlined by yellow and blue lines, respectively). In this case, sample 2 showed significantly different (p < 0.05) color characteristics (L = 58.95 ± 0.86, a* = 11.73 ± 0.43, b* = 33.79 ± 0.59) (TABLE 4). In addition, the chemical analysis revealed the lowest TPC content (7.2 ± 0.3 mg GAE/g, p < 0.05, FIGURE 2A).
However, TLC did not provide enough information necessary to substantially differentiate moringa-derived products. On the contrary, similar bands and patterns were observed for developed moringa extract (sample 1) and non-standardized commercial moringa products (samples 3-7).
Qualitative fingerprint by HPLC
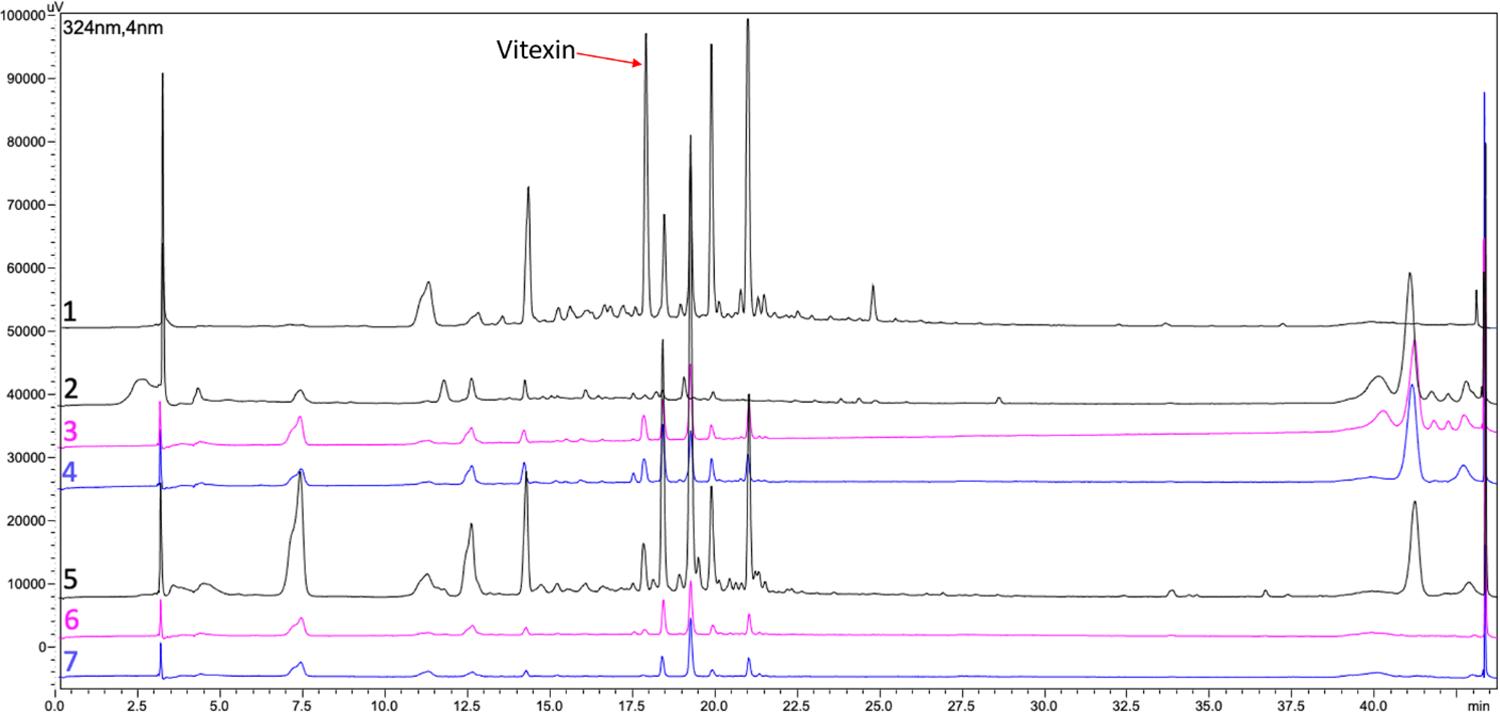
Chromatographic profiles with higher number of peaks and larger peak area indicate samples with more diverse and complex phytochemical profile and sometimes higher phytochemical concentrations, depending on the chemical interaction, column characteristics and detection method. The developed moringa extract (sample 1) showed a complex chemical profile (FIGURE 3), with peaks similar in number to commercial sample 5. On the other hand, remarkable differences are observed in the intensity of the peaks in the chemical profiles of dried leaf extract samples (samples 2 and 5) compared to leaf powder samples (3, 4, 6, and 7; FIGURE 3). Also, there is a visible difference between dried leaf extracts samples (samples 1, 2 and 5) and sample 2 which reinforces our argument regarding the lack of standardization of available moringa samples.
: Qualitative high performance liquid chromatography (fingerprint profile) recorded at 324 nm displaying the regions and peaks of phenolic acids and flavonoids of moringa products investigated in this study. Samples: Developed moringa extract (sample 1) and commercial moringa products (samples 2 - 7). Please refer to TABLE 1 for further description of moringa samples.
It is important to emphasize that standardized and commercial products were analyzed at the same concentration. The chromatograph profile shows notably richer complexity of the dried leaf extract samples (samples 1, 2, and 5) reaffirming that the extraction process concentrates the bioactive compounds[4]. Sample 1, developed moringa extract, had the highest total phenolic content (TPC) (FIGURE 2) and a complex chemical chromatographic profile (FIGURE 3). We hypothesize that the higher concentration of peaks presents in sample 1 is due to the optimized extraction process under controlled conditions that was carried out in the study by Silva et al.[14] belonging to the same research group. The commercial samples do not describe the extraction method or use only the dried leaves. The sample 5, between the commercial dried moringa leaf extract, had the most complex chemical chromatographic profile regarding phenolic acids (1.5-7 min) and flavonoids (10-22 min) (FIGURE 3). Indeed, Chokwe, Dube & Nindi[9] showed that products obtained from different regions and manufacturers have different chemical profiles. This demonstrates the importance of applying a standardized production process to create a traceable, structured supply chain to achieve reliable natural products.
: (A) Total phenolic content (TPC) and (B) Thin layer chromatography (TLC) fingerprint recorded at 365 nm. Adsorbent: silica gel 60 F254. Solvent system: ethyl acetate, acetone, acetic acid, water (60:20:15:10). Samples: Developed moringa extract (sample 1) and commercial moringa products (samples 2 - 7). The red bands region outlined with a white line indicate chlorophyll. Please refer to TABLE 1 for further description of moringa samples.
Quantification of vitexin
Phenolics have been reported as the main phytochemical class of compounds in M. oleifera leaves14,21] and have been correlated with moringa’s health-related attributes[24]. Vitexin is a well-characterized flavonoid that has been used as a chemical marker in the differentiation of species such as Passiflora25 and has been previously identified in Moringa oleifera samples[21,25,26]. Therefore, this study evaluated vitexin as a possible chemical marker for the quality control and standardization of moringa samples.
The presence of vitexin was confirmed by comparison of retention time, UV spectra, and peak area in a moringa extract containing vitexin. The results confirm the presence of this compound in all moringa products tested, validating its utility as a chemical marker for quality control and standardization. TABLE 4 provides a vitexin concentration in various Moringa oleifera products, including a developed moringa extract (sample 1) and commercial moringa products (samples 2-7). Each sample is characterized by its retention time, peak area, peak height, concentration (µg/mL), and the percentage area of the peak. Among the samples obtained commercially, sample 5, exhibits the highest peak area and concentration of vitexin (6.180 µg/mL). Conversely, samples 2 and 7 show the lowest concentration of vitexin (0.247 and 0.213, respectively), suggesting a lower compound content in that particular product.
In summary, vitexin was identified in different quantities between the samples from different countries, which shows the importance for international harmonization of regulation and quality standards for M. oleifera and other herbal medicine products[27].
In vitro antioxidant activity of moringa leaf products
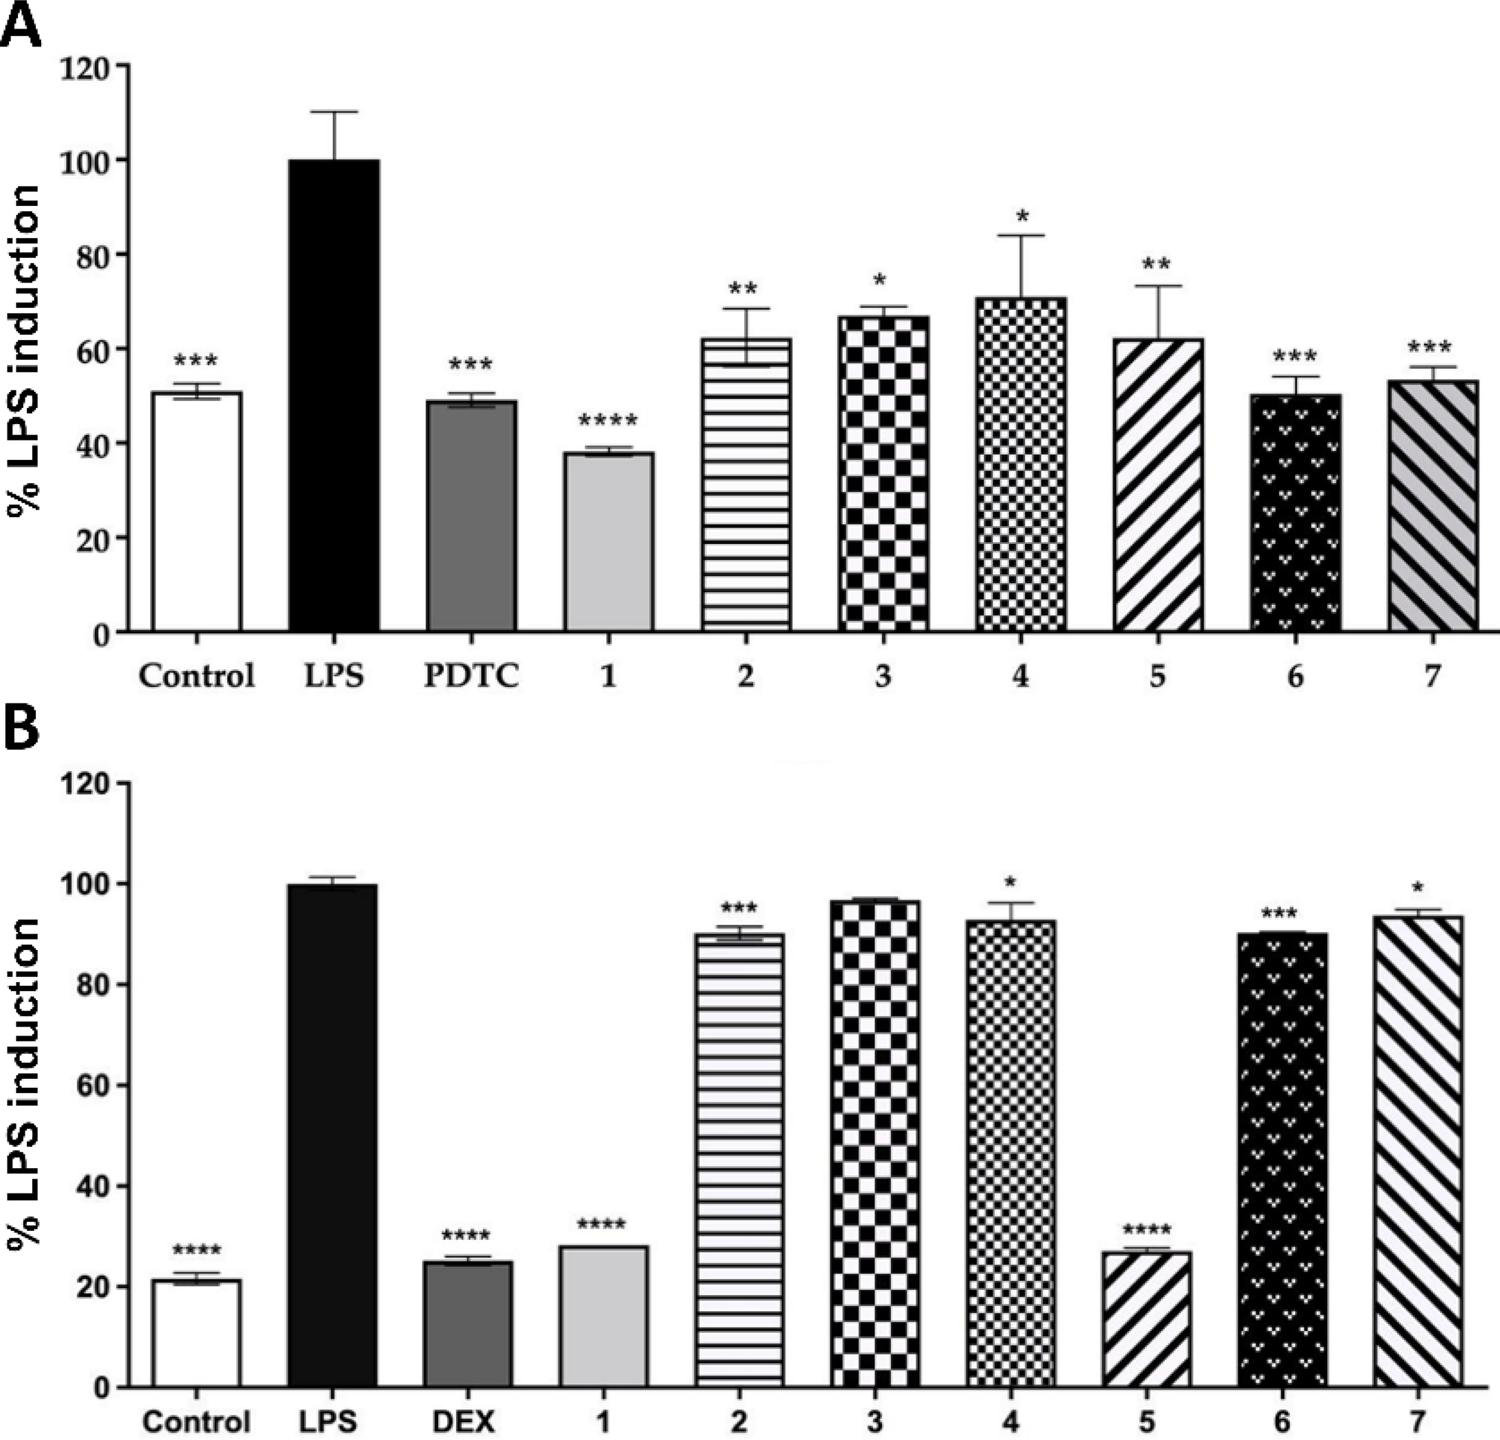
The in vitro reactive oxygen species (ROS) assay was used to evaluate the capacity of the Moringa oleifera samples to suppress the generation of ROS in LPS-stressed cells. Results were normalized by LPS-induced cell fluorescence levels and compared with moringa-treated cells (FIGURE 4A). The PDTC was used as a positive control because it is a potent inhibitor of the NF-κB signaling pathway, which is essential to trigger inflammation processes and diseases[17]. All moringa samples at 50 µg/mL significantly inhibited ROS production in the range of 60% (p < 0.0001) to 30% (p < 0.05) compared to LPS-treated RAW 264.7 cells. The standardized moringa leaf extract product (sample 1) inhibited ROS production more potently (p < 0.0001) than all other commercial products, manufactured from either moringa leaf extracts or dried moringa leaves (samples 2-7), which might be associated with the significantly higher (p < 0.05) TPC found on sample 1 (FIGURE 2B). Our results reiterate previous literature reports that highlight the antioxidant activity of phenolic and flavonoids found in moringa leaves[22]. Peñalver et al.[28] has demonstrated that due to the expressive concentration of antioxidant phenolic compounds in M. oleifera extracts, it can be used as an efficient food complement to combat malnutrition for at-risk population groups in developing countries.
The developed moringa extract (sample 1) at 50 µg/mL significantly inhibited NO production in the range of 70% compared to LPS-treated RAW 264.7 cells (FIGURE 4B). Among commercial moringa products (samples 2-7), sample 5 was the only product with NO inhibition activity comparable to sample 1 and significantly reduced NO production (around 70% reduction; p < 0.0001). Results confirm our hypothesis that the complex phytochemical profile and higher phenolics content found on the moringa extract developed under standardized conditions (sample 1) would lead to higher antioxidant activity. Higher vitexin concentrations found for samples 1 and 5 (FIGURE 4, TABLE 3) could also be related to the higher NO inhibition presented by these two moringa products[27]. Results suggest that moringa products consisting of dried moringa leaf extracts provide more potential biological effects than products derived from moringa leaf powder. In addition, they show that the complex nature of phytoactives obtained from natural products may have different interactions with antioxidant pathways, which demonstrate the relevance of quality control to ensure the efficacy and safety of natural products.
: (A) Reactive oxygen species (ROS) production and (B) Nitric oxide (NO) production in RAW 264.7 macrophage cells stimulated with lipopolysaccharide (LPS). Cells were treated with control (80% ethanol), LPS (100 µg/mL), PDTC (10 µM pyrrolidinedithiocarbamate ammonium for ROS) or DEX (10 µM dexamethasone for NO), developed moringa extract (sample 1, 50 μg/mL), and commercial moringa products (samples 2-7, 50 μg/mL). Results are expressed as the mean ± SD, n = 3. Samples marked with an asterisk are significantly different *p < 0.05, **p < 0.01, ***p < 0.001, ****p < 0.0001 vs. LPS-treated group. Please refer to Table 1 for further description of moringa samples.
In vitro anti-inflammatory activity of moringa leaf products
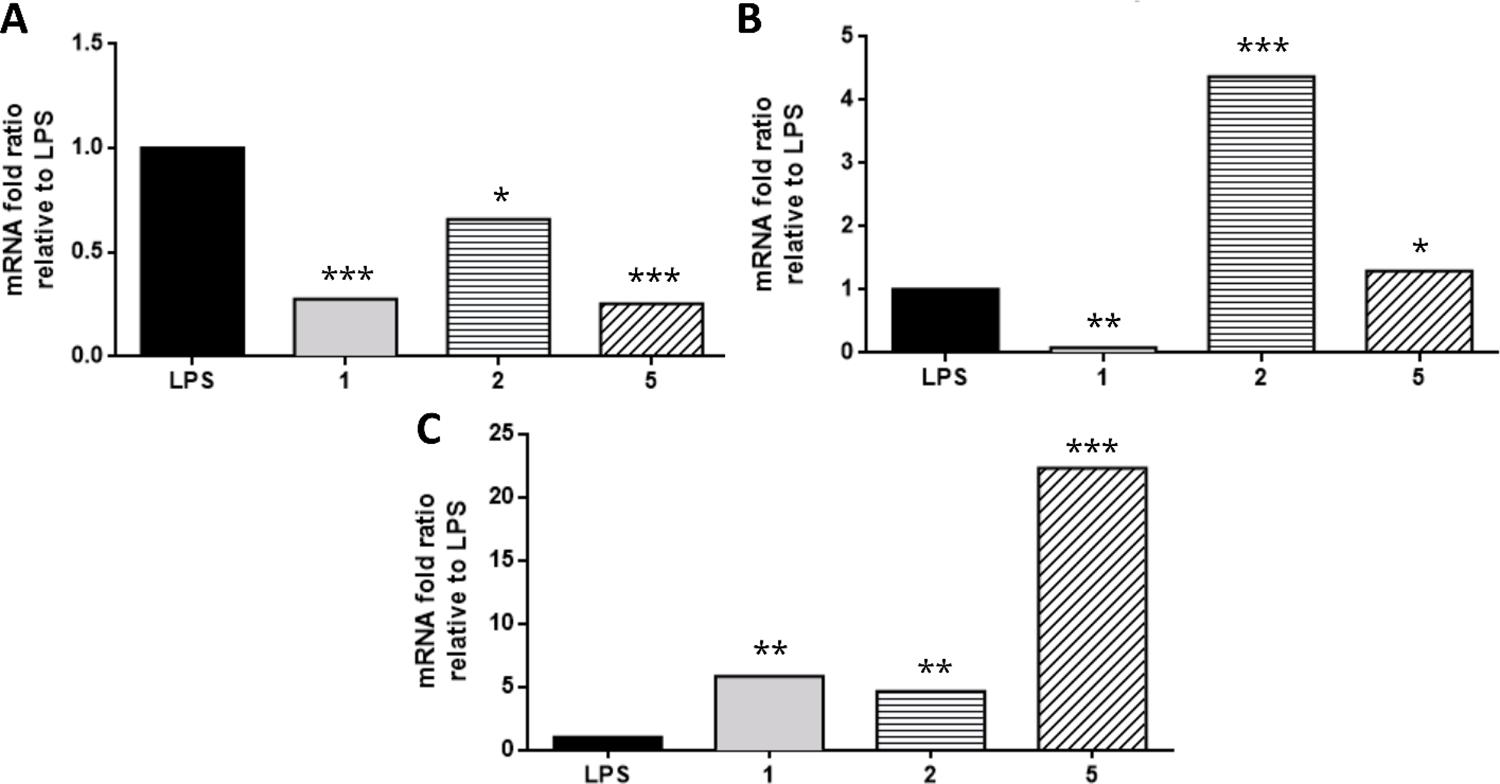
Samples 1 (developed moringa extract) and 5 (commercial moringa leaf extract) were selected for further analysis regarding gene expression of inflammatory markers using RAW 264.7 cells (FIGURE 5) for their superior performance on inhibiting NO production. Moreover, sample 2 was selected for further analysis because of its most distinctive visual aspect (FIGURE 1) and TLC fingerprint (FIGURE 2B), to possibly identify the impact of these different quality traits on the anti-inflammatory activity. The developed moringa extract (sample 1) and commercial moringa leaf extract product (sample 5) showed similar potent down-regulation of genes TNF-α and iNOS, involved in the regulation of inflammatory and oxidative stress mechanisms (FIGURES 5A and 5B). All the samples revealed significant induction in IL-10 amount, with sample 5 having a more significant proportion (p < 0.001). This result corroborates the analyses of Fard et al.[29] when investigating the anti-inflammatory properties of M. oleifera extract. Commercial moringa product sample 5 showed better results than sample 2 (commercial leaf extract), and we hypothesized that the complex phenolic profile (FIGURE 3), high phenolic content (FIGURE 2), and high vitexin concentration (TABLE 3) played a role in the observed results.
: Inflammatory-related gene expression of (A) Tumor necrosis factor (TNF-α), (B) Nitric oxide synthase (iNOS), and (C) Interleukin-10 (IL-10). A–C) using lipopolysaccharide (LPS) stimulated RAW 264.7 cells. Cells were treated with developed moringa extract (sample 1; 50 μg/mL) and commercial moringa products (samples 2 and 5; 50 μg/mL). Samples marked with an asterisk are significantly different *p < 0.05, **p < 0.01, ***p < 0.001 vs. LPS-treated group. Please refer to TABLE 1 for further description of moringa samples.
: (A) Moringa oleifera plant from Brazil used to prepare the developed moringa extract (Silva et al., 2022); (B) Developed moringa extract (sample 1) of M. oleifera leaves; (C) Commercial moringa products (samples 2-7) of M. oleifera leaves (dried leaf extract or dried leaf powder). Please refer to TABLE 1 for further description of moringa samples.
Overall, extract samples 1 and 5 had more potent anti-inflammatory activity. The findings regarding the expression of key inflammatory markers support our original hypothesis that extract samples have more concentrated phytochemical compounds and consequently have a higher anti-inflammatory potential than dried leaf powder.
Conclusion
Despite the many moringa products available in the market, strictly regulated and standardized production protocols are not in place, leading to unreliable and unverifiable health claims. This study compared moringa products developed under standardized conditions and commercial samples, regarding their physicochemical attributes, bioactive compounds content and profile, as well as their effects on the in vitro antioxidant and anti-inflammatory activities. Overall, our results demonstrate the superior quality and phytochemical content of dried moringa leaf optimized extract (84.565 µg/mL of vitexin) versus moringa leaf powder samples (2.826, 2.566, 0.618, 0.213 µg/mL of vitexin). Therefore, the more complex phenolic profile, the high phenolic content, and highest vitexin concentration of the developed moringa extract highlights the relevance of standardization in medicinal plants supply chain to achieve reliable formulations with effective health claims. It is imperative to build an international collaborative network of moringa researchers to collect and share scientific data to help build a dependable information platform, as well as to establish official pharmacopeia monographs. This task would be especially valuable as a contribution to standardize regulations and final products quality requirements to provide the society with well-grounded moringa products with assured therapeutic effects.
Acknowledgments
The authors kindly acknowledge CAPES and CNPq for supporting funds provided to the Federal University of Rio Grande do Norte (UFRN), as well as North Carolina State University (NCSU) for providing research structure to conduct this study.
References
- 1 Castro FD, Silva LMP, Oliveira RB, Zucolotto SM. Potencial efeito terapêutico das folhas de Moringa oleifera Lamarck (Moringaceae): uma revisão do seu papel no controle da glicemia em estudos in vivo. Rev Fitos [Internet]. 2022 Dec 20; 16(4): 508-540. Available from: [ https://revistafitos.far.fiocruz.br/index.php/revista-fitos/article/view/1315 ].
» https://revistafitos.far.fiocruz.br/index.php/revista-fitos/article/view/1315 - 2 Gharsallah K, Rezig L, Rajoka MSR, Mehwish HM, Ali MA, Chew SC. Moringa oleifera: Processing, phytochemical composition, and industrial applications. South African J Bot. [Internet]. 2023 Sep; 160: 180-193. Available from: [ https://linkinghub.elsevier.com/retrieve/pii/S0254629923003873 ].
» https://linkinghub.elsevier.com/retrieve/pii/S0254629923003873 - 3 Leone A, Spada A, Battezzati A, Schiraldi A, Aristil J, Bertoli S. Cultivation, Genetic, Ethnopharmacology, Phytochemistry and Pharmacology of Moringa oleifera Leaves: An Overview. Int J Mol Sci. [Internet]. 2015 Jun 5; 16(12): 12791-12835. Available from: [ http://www.mdpi.com/1422-0067/16/6/12791 ].
» http://www.mdpi.com/1422-0067/16/6/12791 - 4 Singh PA, Bajwa N, Chinnam S, Chandan A, Baldi A. An overview of some important deliberations to promote medicinal plants cultivation. J Appl Res Med Aromat Plants [Internet]. 2022 Dec; 31: 100400. Available from: [ https://linkinghub.elsevier.com/retrieve/pii/S2214786122000328 ].
» https://linkinghub.elsevier.com/retrieve/pii/S2214786122000328 - 5 Yang M, Tao L, Kang X-R, Wang Z-L, Su L-Y, Li L-F, et al. Moringa oleifera Lam. leaves as new raw food material: A review of its nutritional composition, functional properties, and comprehensive application. Trends Food Sci Technol. [Internet]. 2023 Aug; 138: 399-416. Available from: [ https://linkinghub.elsevier.com/retrieve/pii/S0924224423001577 ]
» https://linkinghub.elsevier.com/retrieve/pii/S0924224423001577 - 6 Mukherjee PK, Bahadur S, Chaudhary SK, Kar A, Mukherjee K. Quality Related Safety Issue-Evidence-Based Validation of Herbal Medicine Farm to Pharma [Internet]. In: Evidence-Based Validation of Herbal Medicine. Elsevier; 2015. p. 1-28. Available from: [ https://linkinghub.elsevier.com/retrieve/pii/B9780128008744000015 ]
» https://linkinghub.elsevier.com/retrieve/pii/B9780128008744000015 - 7 Fibigr J , Šatínský D , Solich P . Current trends in the analysis and quality control of food supplements based on plant extracts. Anal Chim Acta [Internet]. 2018 Dec; 1036: 1-15. Available from: [ https://linkinghub.elsevier.com/retrieve/pii/S0003267018309541 ]
» https://linkinghub.elsevier.com/retrieve/pii/S0003267018309541 - 8 Palhares RM, Baratto LC, Scopel M, Mügge FLB, Brandão MGL. Medicinal Plants and Herbal Products from Brazil: How Can We Improve Quality? Front Pharmacol. [Internet]. 2021 Jan 27; 11. Available from: [ https://www.frontiersin.org/articles/10.3389/fphar.2020.606623/full ].
» https://www.frontiersin.org/articles/10.3389/fphar.2020.606623/full - 9 Chokwe RC, Dube S, Nindi MM. Development of an HPLC-DAD Method for the Quantification of Ten Compounds from Moringa oleifera Lam. and Its Application in Quality Control of Commercial Products. Molecules [Internet]. 2020 Sep 28; 25(19): 4451. Available from: [ https://www.mdpi.com/1420-3049/25/19/4451 ]
» https://www.mdpi.com/1420-3049/25/19/4451 - 10 Fejér J, Kron I, Pellizzeri V, Pluchtová M, Eliašová A, Campone L, et al. First Report on Evaluation of Basic Nutritional and Antioxidant Properties of Moringa Oleifera Lam. from Caribbean Island of Saint Lucia. Plants [Internet]. 2019 Nov 23; 8(12): 537. Available from: [ https://www.mdpi.com/2223-7747/8/12/537 ].
» https://www.mdpi.com/2223-7747/8/12/537 - 11 Stohs SJ, Hartman MJ. Review of the Safety and Efficacy of Moringa oleifera. Phyther Res. [Internet]. 2015 Jun 24; 29(6): 796-804. Available from: [ https://onlinelibrary.wiley.com/doi/10.1002/ptr.5325 ].
» https://onlinelibrary.wiley.com/doi/10.1002/ptr.5325 - 12 Ademiluyi AO, Aladeselu OH, Oboh G, Boligon AA. Drying alters the phenolic constituents, antioxidant properties, a-amylase, and a-glucosidase inhibitory properties of Moringa ( Moringa oleifera ) leaf. Food Sci Nutr [Internet]. 2018 Nov 10; 6(8): 2123-2133. Available from: [ https://onlinelibrary.wiley.com/doi/10.1002/fsn3.770 ].
» https://onlinelibrary.wiley.com/doi/10.1002/fsn3.770 - 13 Debelo H, Fiecke C, Terekhov A, Reuhs B, Hamaker B, Ferruzzi MG. Compositional analysis of phytochemicals and polysaccharides from Senegalese plant ingredients: Adansonia digitata (baobab), Moringa oleifera (moringa) and Hibsicus sabdariffa (hibiscus). NFS J [Internet]. 2023 Aug; 32: 100144. Available from: [ https://linkinghub.elsevier.com/retrieve/pii/S2352364623000238 ].
» https://linkinghub.elsevier.com/retrieve/pii/S2352364623000238 - 14 Silva LMP, Inácio MRC, Silva GGC, Silva JMS, Luz JRD, Almeida MG, et al. The First Optimization Process from Cultivation to Flavonoid-Rich Extract from Moringa oleifera Lam. Leaves in Brazil. Foods [Internet]. 2022 May 17; 11(10): 1452. Available from: [ https://www.mdpi.com/2304-8158/11/10/1452 ].
» https://www.mdpi.com/2304-8158/11/10/1452 - 15 Hoskin RT, Xiong J, Esposito DA, Lila MA. Blueberry polyphenol-protein food ingredients: The impact of spray drying on the in vitro antioxidant activity, anti-inflammatory markers, glucose metabolism and fibroblast migration. Food Chem. [Internet]. 2019 May; 280: 187-194. Available from: [ https://linkinghub.elsevier.com/retrieve/pii/S0308814618321502 ].
» https://linkinghub.elsevier.com/retrieve/pii/S0308814618321502 - 16 Esposito D, Chen A, Grace MH, Komarnytsky S, Lila MA. Inhibitory Effects of Wild Blueberry Anthocyanins and Other Flavonoids on Biomarkers of Acute and Chronic Inflammation in vitro. J Agric Food Chem. [Internet]. 2014 Jul 23; 62(29): 7022-7028. Available from: [ https://pubs.acs.org/doi/10.1021/jf4051599 ].
» https://pubs.acs.org/doi/10.1021/jf4051599 - 17 Luetragoon T, Pankla Sranujit R, Noysang C, Thongsri Y, Potup P, Suphrom N, et al. Bioactive Compounds in Moringa oleifera Lam. Leaves Inhibit the Pro-Inflammatory Mediators in Lipopolysaccharide-Induced Human Monocyte-Derived Macrophages. Molecules [Internet]. 2020 Jan 2; 25(1): 191. Available from: [ https://www.mdpi.com/1420-3049/25/1/191 ].
» https://www.mdpi.com/1420-3049/25/1/191 - 18 Choi S-Y, Hwang J-H, Ko H-C, Park J-G, Kim S-J. Nobiletin from citrus fruit peel inhibits the DNA-binding activity of NF-?B and ROS production in LPS-activated RAW 264.7 cells. J Ethnopharmacol. [Internet]. 2007 Aug; 113(1): 149-155. Available from: [ https://linkinghub.elsevier.com/retrieve/pii/S037887410700267X ].
» https://linkinghub.elsevier.com/retrieve/pii/S037887410700267X - 19 Nobossé P, Fombang EN, Mbofung CMF. Effects of age and extraction solvent on phytochemical content and antioxidant activity of fresh Moringa oleifera L. leaves. Food Sci Nutr. [Internet]. 2018 Nov 14; 6(8): 2188-2198. Available from: [ https://onlinelibrary.wiley.com/doi/10.1002/fsn3.783 ].
» https://onlinelibrary.wiley.com/doi/10.1002/fsn3.783 - 20 Ilhan Dincer E , Temiz H . Investigation of physicochemical, microstructure and antioxidant properties of firethorn ( Pyracantha coccinea var. lalandi) microcapsules produced by spray-dried and freeze-dried methods. South African J Bot. [Internet]. 2023 Apr; 155: 340-354. Available from: [ https://linkinghub.elsevier.com/retrieve/pii/S0254629923000844 ].
» https://linkinghub.elsevier.com/retrieve/pii/S0254629923000844 - 21 Rodríguez-Pérez C, Quirantes-Piné R, Fernández-Gutiérrez A, Segura-Carretero A. Optimization of extraction method to obtain a phenolic compounds-rich extract from Moringa oleifera Lam leaves. Ind Crops Prod. [Internet]. 2015 Apr; 66: 246-254. Available from: [ https://linkinghub.elsevier.com/retrieve/pii/S0926669015000035 ].
» https://linkinghub.elsevier.com/retrieve/pii/S0926669015000035 - 22 Kashyap P, Kumar S, Riar CS, Jindal N, Baniwal P, Guiné RPF, et al. Recent Advances in Drumstick ( Moringa oleifera ) Leaves Bioactive Compounds: Composition, Health Benefits, Bioaccessibility, and Dietary Applications. Antioxidants [Internet]. 2022 Feb 16; 11(2): 402. Available from: [ https://www.mdpi.com/2076-3921/11/2/402 ].
» https://www.mdpi.com/2076-3921/11/2/402 - 23 Wagner H , Bladt S . Plant drug analysis: a thin layer chromatography atlas [Internet]. 2 nd ed. Berlin, Heidelberg: Springer Science & Business Media; 1996. Available from: [ http://link.springer.com/10.1007/978-3-642-00574-9 ].
» http://link.springer.com/10.1007/978-3-642-00574-9 - 24 Lin M, Zhang J, Chen X. Bioactive flavonoids in Moringa oleifera and their health-promoting properties. J Funct Foods [Internet]. 2018 Aug; 47: 469-479. Available from: [ https://linkinghub.elsevier.com/retrieve/pii/S1756464618303074 ].
» https://linkinghub.elsevier.com/retrieve/pii/S1756464618303074 - 25 Costa GM, Gazola AC, Madóglio FA, Zucolotto SM, Reginatto FH, Castellanos L, et al. Vitexin derivatives as chemical markers in the differentiation of the closely related species passiflora alata curtis and Passiflora quadrangularis linn. J Liq Chromatogr Relat Technol. [Internet]. 2013 Apr 24; 36(12): 1697-1707. Available from: [ https://www.tandfonline.com/doi/full/10.1080/10826076.2012.695316 ].
» https://www.tandfonline.com/doi/full/10.1080/10826076.2012.695316 - 26 Karthivashan G, Tangestani Fard M, Arulselvan P, Abas F, Fakurazi S. Identification of Bioactive Candidate Compounds Responsible for Oxidative Challenge from Hydro-Ethanolic Extract of Moringa oleifera Leaves. J Food Sci. [Internet]. 2013 Sep 23; 78(9). Available from: [ https://ift.onlinelibrary.wiley.com/doi/10.1111/1750-3841.12233 ].
» https://ift.onlinelibrary.wiley.com/doi/10.1111/1750-3841.12233 - 27 Klein-Junior LC, Souza MR, Viaene J, Bresolin TMB, Gasper AL, Henriques AT, et al. Quality Control of Herbal Medicines: From Traditional Techniques to State-of-the-art Approaches. Pl Med. [Internet]. 2021 Oct 19; 87(12/13): 964-988. Available from: [ http://www.thieme-connect.de/DOI/DOI?10.1055/a-1529-8339 ].
» http://www.thieme-connect.de/DOI/DOI?10.1055/a-1529-8339 - 28 Peñalver R, Martínez-Zamora L, Lorenzo JM, Ros G, Nieto G. Nutritional and Antioxidant Properties of Moringa oleifera Leaves in Functional Foods. Foods [Internet]. 2022 Apr 12; 11(8): 1107. Available from: [ https://www.mdpi.com/2304-8158/11/8/1107 ].
» https://www.mdpi.com/2304-8158/11/8/1107 - 29 Fard M, Arulselvan P, Karthivashan G, Adam S, Fakurazi S. Bioactive extract from Moringa oleifera inhibits the pro-inflammatory mediators in lipopolysaccharide stimulated macrophages. Pharmacogn Mag. [Internet]. 2015; 11(44): 556. Available from: [ https://phcog.com/article/view/2015/11/44s3/s556-s563 ].
» https://phcog.com/article/view/2015/11/44s3/s556-s563
-
Funding:
This research was supported by Coordination for the Improvement of Higher Education Personnel (CAPES, Brazil) PrInt scholarships, grant numbers 88887.570901/2020-00 (LMPS) and 88887.575810/2020-00 (SMZ), finance code 001. This study is part of the D.Sc. dissertation of LMPS conducted at the Graduate Program in Medications Development and Innovation at Federal University of Rio Grande do Norte (UFRN). Funding was available through Hatch Project #1016019 (grant number NC02671) from USDA-NIFA (DE) and National Council for Scientific and Technological Development (CNPq, Brazil), grant number 313727/2020-1 (SZ).
Publication Dates
- Publication in this collection
29 May 2025 - Date of issue
May 2025
History
- Received
08 May 2024 - Accepted
29 Apr 2025